Macroeconomic models, their types and indicators
The circuit diagram is an example of a macroeconomic model. Modeling and abstraction are the main methods of macroeconomic analysis. All macroeconomic processes are studied on the basis of building models. Macroeconomic models represent a formalized (graphical or algebraic) description of economic processes and phenomena in order to identify the main interrelationships between them. To build a model, it is necessary to highlight the essential, most important characteristics for each investigated phenomenon and to abstract (abstract) from insignificant phenomena and factors. Thus, the model is a kind of simplified reflection of reality, which makes it possible to identify the main laws of the development of economic processes and develop options for solving complex macroeconomic problems such as economic growth, inflation, unemployment, etc.
Macroeconomic models can be : functions, graphs, charts and tables, which allows us to understand the interdependence between macroeconomic quantities, cause-and-effect relationships between economic phenomena.
Macroeconomics distinguishes different kinds functions:
a)behavioral characterizing the behavior of economic agents (for example, the consumption function:
C = Co + mpcYd,
where Co - autonomous consumption, independent of the level of income; Yd is disposable income; mpс - a behavioral coefficient, which is called the marginal propensity to consume and shows how the amount of consumption will change with a change in the amount of disposable income per unit);
b) technological describing the production technology (for example, production function:
Y = F (K, L),
where Y is the value of total output, which is determined by the stock of capital (K) and the stock of labor (L), i.e. the amount of basic economic resources;
v) institutional showing the impact of institutional factors (parameters of public administration) on macroeconomic values (for example, the function of taxes:
T = T+ tY,
where T is the amount of tax revenues, T- autonomous (lump sum) taxes that do not depend on the level of income, t is the tax rate, Y is the level of total income (output);
G)definitional reflecting the definition of a particular macroeconomic value (for example, the aggregate demand function, which, by definition, is the sum of the demands of all macroeconomic agents, has the form:
AD = C + I + G + Xn,
where C is the demand of households (consumer spending), I is the demand of firms (investment spending), G is the demand of the state (government procurement of goods and services), and Xn is the demand of the foreign sector (net exports)
All these functions can be presented in the form of graphs and tables.
The models include two types of indicators: exogenous and endogenous.
Exogenous quantities- these are indicators that are set from the outside, formed out of model... Exogenous quantities are autonomous(independent ). Endogenous quantities are indicators that form inside the model.
| Endogenous variable |
| Exogenous variable |
| MODEL |
Rice. 1.4
The model allows us to show how a change in exogenous quantities (external impulse) affects a change in endogenous ones (Figure 1.4.). For example, if the consumption function has the form: C = C (Yd, W), where C is the total consumer spending, Yd is disposable income and W is wealth, Yd and W are exogenous quantities, and C is endogenous. This model allows us to investigate how changes in disposable income and / or wealth change the amount of consumer spending. Consumption, therefore, acts as a dependent quantity (function), and disposable income and wealth, as independent quantities (function argument). In different models, the same value can be both exogenous and endogenous. So, in the consumption model, consumer spending (C) acts as an endogenous (dependent) value, and in the aggregate demand model: AD = C + I + G + Xn, consumer spending (C) is an exogenous (independent) value, i.e. a variable that determines the amount of total output and total income. The exception is government variables, which are usually exogenous, such as government purchases of goods and services, lump sum taxes, tax rates, the amount of transfers, the discount rate of interest, the reserve requirement, and the monetary base.
Besides variables, models include parameters and constants. These include all behavioral coefficients such as marginal propensity to consumption, the marginal propensity to save, the deposit rate, the rate of excess reserves, as well as indicators of elasticity (sensitivity), such as the sensitivity of investments to changes in the interest rate, the sensitivity of the demand for money to changes in income, the degree of capital mobility, etc.
Important feature macroeconomic variables is that they are divided into two groups: flow rates and stock indicators . Flow(flow) is the quantity for a certain period of time. In macroeconomics, as a rule, the unit of time is a year. Flow indicators include: total output, total income, consumption, investment, deficit (surplus) state budget, the number of unemployed, exports, imports, etc., since they are all calculated every year, i.e. per one year. All indicators displayed in the circuit diagram are flows. (It is no coincidence that this scheme is called the model of circular flows). Stock(stock) is the quantity at a certain point in time, i.e. on a specific date (for example, January 1, 2000). Stock indicators include national wealth, personal wealth, capital stock, the number of unemployed, production potential, government debt, etc.
Macroeconomic indicators can also be divided into: absolute and relative. Absolute indicators are measured in monetary (value) terms (with the exception of indicators of the number of employed and the number of unemployed, which are measured in the number of people), and relative- as a percentage or relative values... Relative indicators include such as the unemployment rate, deflator ( general level prices), inflation rate, economic growth rate, interest rate, tax rate, etc.
Figure 1.5. Types of balances
Stable balance Unstable balance Neutral
The importance of in macroeconomics is the study of equilibrium states. In this case, there are three types of balance: stable, unstable and neutral(Figure 1.5) . The equilibrium in the system is considered sustainable if, being derived from equilibrium state, the system returns to it on its own; unstable if not returned, and neutral if it is impossible to say with certainty whether the system will return to its original state or not.
In macroeconomic models great importance It has time factor... Depending on how this factor is taken into account in the analysis, there are three types of macroeconomic models: static, comparative statics and dynamic(while research can be carried out both in discrete and continuous time). Static models describe the economic situation at a particular point in time. Models comparative statics show the result of the transition of an economic system from one equilibrium state to another, but do not investigate how this transition occurs. The mechanism of this transition process is studied in dynamic models.
In dynamic models important role plays discount principle, i.e. bringing the cost of future income to the present period (present value - PV). The discounting method is used to determine the effectiveness of investments in financing investment projects (financing investment project it makes sense if the amount of future income, reduced to the present period, is not less than the cost of financing it), when purchasing securities (which is advisable only if the reduced total income from this security is not less than the amount spent on its purchase), with the intertemporal choice of consumption (when deciding on the preference of future consumption over the present). The present value is calculated using the formula:

where x 1, x 2, ... x n are the incomes that the economic agent expects to receive in each of the future periods (from the first to the nth), r is the discount rate, which in macroeconomic models, as a rule, is assumed to be equal to the interest rate. The macroeconomic meaning of the interest rate is that it represents the opportunity cost of using money in a different way.
Types of models:
- By the degree of generalization:
- Specific;
- Abstract;
- By duration:
- Short-term;
- Long term;
- By the nature of the relationship of elements:
- Linear;
- Non-linear;
- By the degree of coverage of the foreign sector:
- Closed;
- Open:
- Taking into account the time factor:
- Statistical;
- Dynamic.
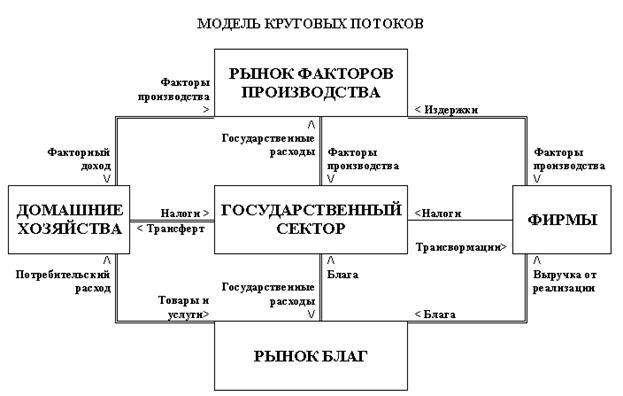
4. Model of circular flows.
The most famous theoretical model that displays a stable real and cash flows between economic agents is
« Circular flow model».
She suggests:
- Household interaction; firms; the public sector and the rest of the world sector.
- The public sector includes:
- State enterprises and institutions;
- Explored mineral reserves;
- Insurance reserves of the state (fuel, raw materials, food, gold reserves);
- State loan;
- Securities.
The limiting conditions of this model:
- Not taken into account possible changes prices;
- The values of flows and costs are unchanged;
- The processes taking place inside the sectors are not considered;
- Environmental issues are not taken into account.
The model uses various economic variables:
I. Exogenous and endogenous indicators.
Exogenous variables are input information. Are set before building the model.
These include:
1. Taxes;
2. Money supply;
3. Government spending;
a. Transfer (gratuitous payments);
b. Transformational (public procurement)
"Expenses accompanied by a counter service" A.Pigou.
Endogenous variables are formed within the model, under the influence of exogenous variables (inflation rate, unemployment rate).
II. Flow and stock variables.
Flow is a quantity measured per unit of time (Number of people losing their jobs, GDP).
Reserve - a value measured at this period time (number of unemployed, national wealth).
Macroeconomics subject
Macroeconomics is a branch of economic science that studies the behavior of the economy as a whole from the point of view of ensuring conditions for sustainable economic growth, full employment of resources and minimizing inflation.
Subject macro economic theory is the study of macroeconomic phenomena that are not associated with any one sector of the economy, but are related to all sectors of the economy and should receive a general (macroeconomic) explanation. Macroeconomics examines the behavior of an economy viewed as a whole: its ups and downs, the problem of inflation, unemployment. It should be noted that some macroeconomic issues relate to the country's economy, and some may have implications for a number of countries (for example, the world oil or financial crises). In this case, we are dealing with global macroeconomic analysis.
Macroeconomics is considered as a change in the volume of production and employment in long term(economic growth) and their short-term fluctuations that form business cycles.
The main problems studied at the macroeconomic level are:
1) determination of the volume and structure of the national product and ND;
2) identification of factors regulating employment throughout the economy;
3) analysis of the nature of inflation;
4) study of the mechanism and factors of economic growth;
5) consideration of the reasons for cyclical fluctuations and market changes in the economy;
6) research of foreign economic interaction of national economies;
7) theoretical background goals, content and forms of implementation of the state's macroeconomic policy.
Macroeconomic models. Exogenous and endogenous variables
Macroeconomics uses two methods of analysis:
Macroeconomic analysis ex post (national economic accounting), the purpose of which is to determine the values of macroeconomic parameters of the past period in order to obtain information about how the economy functioned and what are the results achieved. This information serves to determine the degree of implementation of the set goals, the development of economic policy;
Macroeconomic analysisex ante– predictive modeling of economic phenomena and processes based on certain theoretical concepts. Its purpose is to establish the laws governing the formation of macroeconomic parameters. Thus, the entire system of markets in macroeconomics is studied using models that are formalized (tabular, graphically, algebraically) descriptions of various economic phenomena, processes in order to identify functional relationships between them. The model is a simplified, abstract reflection of reality, since all the details cannot be simultaneously taken into account in the study. Values that are outside the model are usually called exogenous (the main instruments of the government's fiscal policy and monetary policy of the Central Bank are changes in values government spending, taxes, money supply etc.), and those determined by the model are endogenous (output, employment, price level, rate wages and interest rate, etc.).
So, exogenous variables are variables that are set from the outside, their value is formed outside the model. These variables are independent values in the model, and their change is called autonomous change. Endogenous variables are variables that are generated within the model; these variables are dependent. Any model links certain exogenous and endogenous parameters. It allows you to show how a change in exogenous variables affects a change in the magnitude of endogenous variables. In different models, the same value can be both exogenous and endogenous. The exception is government variables (political variables), which, as a rule, are exogenous in macroeconomic models: government purchases of goods and services, lump-sum taxes, tax rates, the amount of transfers, the discount rate of interest, the rate of required reserves, and the money supply.
So, for example, in the model (function) of consumption C = C (Yd), consumer spending (C) acts as an endogenous (dependent) value, and in the model of aggregate demand AD = C + I + G + NX, consumer spending (C) is exogenous (independent) value, i.e. a variable that determines the amount of total output and total income.
When constructing macromodels, the following types of functional equations are used: behavioral functions (for example, consumption function, saving function), institutional functions (for example, tax function), determinative functions that characterize dependencies arising from the definition of the essence of an economic phenomenon, functions that characterize technological conditions production (for example, production function).
Economic variables can be represented as flows and stocks. Flow is an economic variable that is measured in motion over the period of time for which the calculation is made. For example, GDP for a year, volume of investments for a year, budget deficit, consumer spending for a year, wages for a month, products produced per day, etc. act as streams. Unlike flows, stocks have no time dimension and are settled on a specific date. For example, the value of the money supply in the country, the state debt, the number of unemployed, the capital accumulated in the economy at a certain date. Streams cause changes in stocks. Thus, flow variables are measured per unit of time (per month, quarter, year); the variables of the stock can be measured only at a certain point in time and characterize the state of the object of study at a certain date (beginning or end of the year, etc.). The relationship of flows and stocks forms the basis of the initial macroeconomic model of circular flows (to be discussed in topic 2).
Macroeconomic indicators can also be presented as absolute and relative. Absolute indicators are measured in monetary (value) terms (total output, national income, total consumer spending, total investment spending, tax revenues, etc.) or in the number of people (labor force, total the number of unemployed, etc.) Relative indicators are measured in percent or fractions of a unit (general price level, unemployment rate, inflation rate, economic growth rate, interest rate, tax rate, etc.).
Macroeconomic theory uses an equilibrium approach (known to us from microeconomics) when studying aggregate, or aggregated values. Equilibrium states are sought not in the markets of individual goods or factors of production, but on the scale of the entire economy (search for the “intersection point” of the curves of aggregate demand and aggregate supply, demand for money and supply of money, etc.). The analysis determines what causes the deviation from macroeconomic equilibrium and how the state seeks to balance the economy.
Time tracking in economic research carried out by isolating short and long periods... The subject of analysis in short period are the streaming values of the national economic circulation (income, savings, depreciation, investments, etc.) and their impact on the volume of stocks (property). The reverse impact of changes in the volume of property on flows is not taken into account. A comprehensive analysis of the interaction of economic flows and stocks is carried out on models of economic processes in a long period.
In macroeconomics (as well as in microeconomics), the research method is used “ceteris paribus”. Its essence lies in the fact that many factors influencing the object of research are taken as given and unchanged; only those changes, the effect of which on the studied object must be established. The obtained data are then used when carrying out general analysis, which takes into account the complex impact of all the main factors on the object under study.
Special meaning in the study of macroeconomics acquires a normative and positive analysis. Regulatory analysis is aimed at finding out how it should be, i.e. how the government should act in this or that case to maximize public welfare. Positive analysis is an analysis designed to explain not how it should be, but how various macroeconomic variables are interrelated, how a country's economy works.
Topic 1. Introduction to macroeconomics.
- 1. The subject of macroeconomics. Key macroeconomic issues.
- 2. Macroeconomic models. Exogenous and endogenous variables. Stocks and flows in the economy.
- 3. Macroeconomic policy
- 4. Conditions of macroeconomic equilibrium.
- 1.
The subject of macroeconomics. Key macroeconomic issues.
1.sustainable economic growth
2.full employment of resources
3.reduction of inflation
4.macroeconomic equilibrium
5.balance of payments
- 2.
Macroeconomic models. Exogenous and endogenous variables. Stocks and flows in the economy.
In macroeconomics, there is also a division of variables into:
1. stock variables - characterize the state of the object at a certain point in time - government debt, the number of unemployed, the volume of investments, etc.
2. flow variables - characterize the dynamics of economic processes - the dynamics of investments, consumer spending for the year, etc.
3. Macroeconomic policy
Macroeconomic policy - government action aimed at regulating the economy in order to maintain economic growth, full employment and curb inflation. The main objective of macroeconomic policy is the balance between unemployment and inflation. Macroeconomic policy is subdivided into: fiscal policy, monetary and other types.
Fiscal policy (budgetary and taxation, financial, financial and budgetary) extends its effect to the main elements of the state budget - taxes and government spending.
Monetary (monetary policy) - regulation of the money supply and money circulation in the country through direct government influence or influence through the central bank of the country. It ensures proper functioning monetary system and money circulation, extending its influence both on money and on prices. Its main tasks are: stabilizing the price level, suppressing inflation, stabilizing the purchasing power and the exchange rate of the national currency in the domestic and foreign markets, ensuring stable money circulation in conditions of free market prices, regulating the money supply, money supply and demand.
Macroeconomic policy is stabilizing and is used to smooth out fluctuations economic cycle: during the recession, a stimulating fiscal and monetary policy, during the period of recovery in order to avoid overheating of the economy - a restraining policy.
- 4.
Macroeconomic equilibrium conditions.
- resources and their use;
- factors of production and the results of their use;
- total production and total consumption;
- aggregate supply and aggregate demand;
- material and financial flows.
This balance is an economic ideal: no bankruptcies and natural disasters, no socio-economic upheavals. In economic theory, the macroeconomic ideal is the construction of general equilibrium models of the economic system. V real life there are various violations of the requirements of such a model. But the meaning theoretical models macroeconomic equilibrium allows one to determine the specific factors of deviations of real processes from ideal ones, to find ways to implement the optimal state of the economy.
In economic science, there are many models of macroeconomic equilibrium, reflecting the views of different directions of economic thought on this problem:
F. Quesnay - a model of simple reproduction on the example of the French economy in the 18th century;
K. Marx - schemes of simple and extended capitalist social reproduction;
V. Lenin - schemes of capitalist social extended reproduction with a change in the organic structure of capital;
L. Walras - a model of general economic equilibrium in the conditions of the law of free competition;
V. Leontiev - the “input-output” model;
J. Keynes - a model of short-term economic equilibrium.
Macroeconomic equilibrium is the central problem of social reproduction. Distinguish between ideal and real balance.
The ideal is achieved in the economic behavior of individuals with the full optimal realization of their interests in all structural elements, sectors, spheres of the national economy.
Achieving such an equilibrium presupposes the observance of the following reproduction conditions:
All individuals must find commodities in the market;
All entrepreneurs must find factors of production in the market
The entire product from last year must be implemented.
Ideal equilibrium proceeds from the prerequisites of ideal competition and the absence of side effects, which, in principle, is not realistic, since in the real economy there are no such phenomena as perfect competition and a clean market. Crises and inflation throw the economy out of balance.
Real macroeconomic equilibrium is an equilibrium that is established in the economic system under conditions of imperfect competition and with external factors affecting the market.
Topic 2. Macroeconomic indicators.
- System of National Accounting. Key macroeconomic indicators.
Calculation of GDP by expenditure and income. Basic macroeconomic identities.
Nominal and real variables. Deflator and consumer price index.
Circulation of income and expenses. Leaks and Injections
System of National Accounting. Key macroeconomic indicators.
- The main indicator of the SNA is gross domestic product- GDP - the cost of final products produced by residents of the country for the year.
Residents- economic entities, regardless of citizenship, having an economic interest in the territory of a given country.
- 2.
Calculation of GDP by expenditure and income. Basic macroeconomic identities.
1) Production (value added) - the summation of the value added at each stage of the production of the final product. Added value- the difference between the value of manufactured products (output) and the value of products consumed in the production process (intermediate consumption).
The production method, due to its simplicity, is the most frequently used in statistics.
2) End-use method (calculating GDP by expenditure) - the summation of the costs of the final consumption of products. It includes aggregation costs such as:
- Personal consumption expenses- С - household expenditures on durable goods and current consumption and services (this does not include the cost of buying a home).
- Gross investment- I - investment in fixed assets + investment in housing + investment in stocks. In other words, gross investment is the sum of net investment and depreciation charges... In addition, in the latest revision of the SNA, investments include the acquisition of items that are not used for production or consumer purposes, but for the preservation of value - precious metals and stones, antique, jewelry and other collections. The purchase of securities is not included in the investment, because is a reallocation of existing assets.
- Government procurement of goods and services- G - expenses for the maintenance of the army, police, state administrative apparatus, construction and maintenance of social infrastructure facilities, etc. This component does not include government transfers - payments by government agencies that are not related to the movement of goods and services.
- Net export- X n = export - import.
Thus, GDP by expenditure is defined as: GDP = C + I + G + X n.
GDP per capita in Kazakhstan today is 3600 US dollars (to enter the 50 competitive countries of the world, it must be 5500-6000). Since GDP, as before, is calculated only by the production method, its structure in terms of expenditures cannot be traced according to official statistics. The structure of GDP by industry is dominated by production in the oil and gas complex, metallurgy, i.e. dominated by production in the extractive industries. More than 80% of direct investments in the country go to these industries. Construction is now a rapidly growing industry, while investment activity in non-resource sectors remains low.
3) Distribution method (income calculation) - the summation of the primary income of residents. In the latest revision of the SNA, these include:
- Remuneration of wage earners, including both the main part (wages) and additional (bonuses, allowances), as well as employers' contributions to social insurance.
- Indirect taxes: VAT, excise taxes, sales taxes, land taxes, payroll taxes, etc.
- Gross profit and gross mixed income, i.e. net income and net mixed income + depreciation. This component includes rent, interest and other income that are paid in the course of further redistribution of primary income.
There is another interpretation of the calculation of GDP by income - we considered it last year.
In addition to GDP, GNP is also calculated (in the latest revision of the SNA, it is called gross national income - GNI), which is the sum of primary income received by residents of the country. It differs from GDP by the amount of the balance of primary income - the difference between the income of residents of a given country received abroad and the income of non-residents received in the country and transferred abroad. Thus, GNI = GDP + balance of primary income.
Subtracting the cost of consumed fixed capital (depreciation deductions) from GDP or GNI, we get two more SNA indicators - net domestic product and net national income.
In addition, personal income can be calculated (although this indicator as such is not included in the SNA). Personal income = PND - social security contributions, indirect taxes, retained earnings of corporations, income taxes + transfers. Personal income is the amount of income received by residents of a given country. If we subtract from them the amount of income taxes and non-tax payments, we get personal disposable income.
Basic macroeconomic identities:
1. Identity of equality of income and expenses: Y = C + I + G + X n .
2. Identity of savings and investments. In the simplest model of a closed economy, where there is no government intervention in the economy and foreign economic activity, GDP in terms of expenditures is: GDP by expenditure = С + I... In this case, the income received by any economic entity is spent on consumption and savings: GDP by income = C + S... Equating both parts, we get: C + I = C + S or I = S.
Let's complicate the model by introducing the state and the outside world into it. Then the total savings are equal to the sum of private, public savings and the savings of the rest of the world: S = S p + S g + S r .
Private savings are equal to the sum of income, transfers, interest on government debt minus consumption and taxes: S p = (Y + TR + N) - T - C.
Government savings are defined as: S g = T - TR - N - G.
The savings of the outside world are equal to the income received outside world due to our imports, minus the costs of our exports: S r = IM - X = -X n .
Combining the formulas, we get: S p + S g + S r = = [(Y + TR + N) - T - C] + + + + [-X n ] = Y - C - G - X n . Thus, we got again: S = I.
3. Identity of the state budget: BD =? M +? B, where? M is an additional money issue,? B is an issue of government securities (ie, the budget deficit can be financed by an additional emission of money or issuance of government securities).
- 3.
Nominal and real variables. Deflator and consumer price index.
Nominal GDP
Real GDP =
Price index
An upward adjustment in nominal GDP is called inflation (price index< 1); корректировка номинального ВВП в сторону уменьшения – дефлирование (индекс цен > 1).
The most widely used price indices in economic theory are the Paasche index and the Laspeyres index.
Laspeyres index (consumer price index) is calculated as the change in the prices of the basic consumer basket that occurred during the current period: I L =? P 1 X 0 /? P 0 X 0, where
P 0 - prices of goods included in the basic consumer basket X 0 in the basic year;
P 1 - prices of goods included in the basic consumer basket X 0 in the current year.
Paasche index (GDP deflator) is calculated as an estimate of the value of the current consumer basket in prices of the base period. Under consumer basket is understood as a set of consumer goods that provides a rational level of consumption.
I P =? P 1 X 1 /? P 0 X 1 - Paasche index, where
P 0 - prices of goods included in the current consumer basket X 1 in the base year;
P 1 - prices of goods included in the current consumer basket X 1 in the current year.
The Pasche index is actually equal to the ratio of nominal to real GDP in the current period:
Nominal GDP
GDP deflator =
Real GDP
- 4.
Circulation of income and expenses. "Leaks" and "Injections"
In macroeconomics, there are two types quantitative variables: stocks and flows.
Stock is an indicator measured as a quantity per this moment. Flow- a quantity measured as a quantity per unit of time.
For example, stock- consumer property, flow- his income and expenses; stock- the number of unemployed, flow- the number of people losing their jobs; stock- accumulated capital in the economy, flow- investment size; stock- state debt, flow- budget deficit.
In macroeconomic theory, there are three basic circuit models.
Circulation model in a closed economy, in which only two groups participate economic actors: households and firms.
In this model, the state and the outside world are absent, that is, a closed economic system is assumed, where the income of some economic entities is shown as the expenses of other economic entities. For example, the expenditures of firms on resources at the same time act as household income, and the stream of consumer expenditures is the income of firms from the sale of finished goods. The model assumes that the volume of sales of firms is equal to the volume of household income. The flows "income-expenses" and "resources-products" occur simultaneously in opposite directions and are constantly renewed.
In order to observe equilibrium in this model, the following is necessary:
· national income should be equal to the cost of its acquisition: Y = consumer spending + planned investment. If, in addition to the planned investment costs, there are unplanned investments, then the economic system goes out of balance;
· observance of the identity of investments and savings in the financial market: C + I = C + S or I = S, since the costs of GNP and the income received as a result of its production are equal.
State participates in the regulation of the economy three in the main ways:
· collects taxes and makes social payments to certain categories of citizens: those who are not “yet” working (for example, scholarships), and those who “no longer” work (pensions, benefits). The state collects taxes from both enterprises and individual citizens, but in the circuit model it is assumed that economic agents are divided according to their functional purpose and the owners of firms who pay taxes are in the household sphere. Therefore, households pay taxes while receiving transfers, the difference between them forms net taxes;
· acts as a buyer in the market of goods, where government purchases of goods and services are carried out. State procurements- these are purchases for the construction and maintenance of schools, roads, the army and the state administration. In addition to costs on the product market, the state carries out costs for the remuneration of civil servants, therefore, these costs are also included in public procurement;
· has an indirect effect on the economy by regulating the amount of money in the economy. Government procurement costs and taxes generally do not coincide in magnitude. The difference between net taxes and government spending is savings of the state... If government savings are positive, then they amount to budget surplus if negative - budget deficit, which can be financed by the issue of money or bonds.
Government savings, like household savings, are channeled into the property sector.
Circulation model with the rest of the world.
The model becomes even more complicated when a foreign sector is introduced into it, which turns a closed system into an open economy. The foreign sector (external (rest) world, abroad) is linked to the economic system three ways:
· through the import of goods and services;
· through the export of goods and services;
· through international and financial organizations.
Real and cash flows are free if total expenditures households, firms, government and the outside world are equal to the total volume of production.
The difference between exports and imports is net export, which goes to the goods market, but does not go to the property sector.
If the export does not cover the import, then the difference must be paid through loans from foreign financial intermediaries or through the sale of real or financial assets. foreign buyers... Such operations are called net capital inflows.
Capital inflows- the net amount obtained through loans from foreign financial intermediaries, as well as through the sale of real or financial assets to foreign buyers.
Capital outflow- the net amount of loans issued to foreign borrowers and funds used to purchase real or financial assets from foreign sellers.
V market economy the expense of one entity is the income of another entity, and vice versa. In this regard, all the budgets of economic entities are interconnected, and a circulation of money arises in the country's economy. From these positions, the circuit is a set of budgets of all economic entities in their relationship.
The national economic circulation can be represented in four ways:
· Equation;
· table (matrix);
· diagram (diagram);
· accounting account, which is used to build a system of national accounting.
The budget will be balanced if the total values of these flows are equal for all economic entities:
Households:
Y = C + T + S.
Firms:
Y + Z = C + I + G + E.
State:
G = T + (G - T).
Abroad:
Z = E + (Z - E),
where ( Z - E) - trade balance.
The main flows of the national economic circulation are presented in the form of diagrams (Fig. 2.1-2.3). In an open economy with government intervention, there are “leaks” from the “income-expenditures” stream and, at the same time, additional funds are injected in the form of “injections”.
"Leaks" is income that is not used by households to purchase domestically produced products. They come in the form of savings, tax payments and imports ( S + T + Z).
"Injections"- the cost of financing the national product - investment, government procurement, export costs ( I + G + E).
Based on the equality of the national product and national income, we have:
C + I + G + (E - Z) = C + T + S.
After transforming the equation, we get:
I + G + E = S + T + Z,
that is, the total amount of "injections" is equal to the total amount of "leaks".
The equation of "leaks" and "injections" can be represented as:
I + (G - T) = S + (Z - E),
where S is internal savings; Z - E - net imports financed by capital inflows.
Topic 3. Macroeconomic instability. Economic cycles of unemployment. Inflation.
- 1. The economic cycle and macroeconomic dynamics.
- 2. Forms of unemployment. Natural unemployment rate. Okun's Law.
4. The relationship between unemployment and inflation. Phillips curve.
1. Economic cycle and macroeconomic dynamics.
Economic cycle - periodic fluctuations in GDP, employment, inflation. In the economic literature, there are many reasons for cyclicality (which are classified into external and internal), and therefore there is no single theory of the cycle. There are no generally accepted names for the phases of the cycle: rise (recovery, expansion,), the upper point of the rise - peak (boom), recession (crisis, recession), bottom point recession - depression. Graphically, the cycle can be represented as
Gdp
CYCLE Years
Fluctuations in the price level are reflected by the GDP deflator, which shows the deviation of real GDP from nominal.
Fluctuations in output are reflected by the "GDP gap" indicator, which shows the deviation of actual GDP from potential:
GDP gap = (Y-Y *) / Y *, where
Y - actual release
Y * - potential output at full employment, i.e. with a natural level of unemployment and non-utilization of production capacities at the level of 10-20% of the total.
The most striking manifestations of macroeconomic instability are unemployment and inflation.
2. Forms of unemployment. Natural unemployment rate. Okun's Law.
Unemployment is a socio-economic phenomenon in which a part of the economically active population does not participate in the production of goods and services. Unemployment is also characterized by the fact that it is never evenly distributed among the population. It varies considerably in terms of geography, age, gender, and race.
There are the following types of unemployment:
1. Frictional - associated with the search and expectation of work
2. Structural - associated with technological shifts in production
The sum of frictional and structural unemployment is the natural unemployment rate corresponding to the potential GDP - NAIRU (Non-Accelerating-Inflation Rate of Unemployment).
3. Cyclical unemployment - the deviation of actual unemployment from the natural level, the result of a decline in production.
According to the ILO classification, the population of any country is divided into:
1.people who make up the workforce ( L)
2.people who are not part of the workforce ( N)
3.employed (E)
4.the unemployed (U)
Unemployment rate is the ratio of the number of unemployed ( U ) to the total labor force ( L):
u = U / L 100%
Different economic schools give different reasons for unemployment:
1. The classical theory sees the cause of unemployment in the intervention of the state and trade unions in the market mechanism of price formation in the labor market. As long as the state and trade unions did not influence the size of wages, equilibrium wages were established and there was no unemployment. If wages are too low, the supply of labor decreases and wages rise, if too high, on the contrary. Strengthening the role of trade unions and government regulation of wages inflates the price of labor and makes it inflexible, which causes unemployment. In an unregulated free market economy, only voluntary unemployment can exist.
2. Keynesian theory explains unemployment by insufficient aggregate demand. According to Keynes, unemployment is inherent in the market economy (and this is not voluntary, but forced unemployment) due to imbalance AD -А S ... Moreover, the supply of labor is a function of nominal wages (if prices rise and real wages fall, the worker will continue to work anyway), and the demand for labor is a function AD ... Consequently, employment and unemployment are more dependent on employers than workers. In view of all this, the state must implement a policy of employment regulation.
Currently, employment policy is based on a combination of Keynesian and neoclassical approaches: impact on aggregate demand, as well as general economic recovery by creating a favorable investment climate and, as a result, creating new jobs. Share of government spending allocated to maintaining employment in developed countries fluctuated in the 90s. from 2.3% (Spain, 1999) to 5.6% (Sweden, 1994). Employment policy includes:
- programs to stimulate employment and increase the number of jobs;
- programs for training, retraining and advanced training of employees;
- programs to promote the recruitment of labor;
- social insurance programs against unemployment.
The social protection system against unemployment is focused on material support unemployed. In developed countries, unemployment benefits are set at 60% or more of the average wage, and these benefits are paid for 1-5 years.
In Kazakhstan 1990-1999 the unemployment rate rose steadily (in 1999, according to official data, it was 13.5%). Since 2000, the situation has begun to improve - in 2000, 12.8%, in 2001 - 10.4% (for example, in the United States in 2000, this figure was 4.2%). In 2006, the unemployment rate in the Republic of Kazakhstan was over 7%.
Okun's Law shows the relationship between unemployment and GDP: with an increase in cyclical unemployment by 1%, the actual GDP lags behind the potential by?%, Where? - empirical coefficient of GDP sensitivity to the dynamics of unemployment (from 2 to 3%):
(Y-Y *) / Y * = -? (U - u *).
- 3.
Inflation. The level and types of inflation.
Deflation is a steady decline in prices in an economy.
Inflation rate (rate of price growth) - the relative change in the average price level:
? = (P - P -1) / P -1
R - average level prices (CPI or deflator) in the current year
Р -1 - average price level (CPI or deflator) last year
Deflation is a decrease in the rate of inflation.
Types of inflation:
1. Demand inflation - arises from the growth of AD
2. Cost inflation - arises from a decline in AS due to rising costs - it usually leads to stagflation - a combination of stagnation (production decline) and inflation.
The combination of demand inflation and cost inflation leads to the unwinding of an inflationary spiral, in which inflationary expectations of the population play the role of a transmission mechanism.
Depending on the rate of price growth, creeping, galloping and hyperinflation are distinguished.
There are also expected and unforeseen inflation; open and suppressed inflation.
According to the exchange equation MV = PY, inflation can be caused by an increase in the money supply, an increase in the velocity of money circulation, or a fall in output. The first reason may be provoked by the government. With the help of money emission, it can cover the budget deficit (monetization of the deficit), which leads to an increase in prices. As a result, an inflation tax arises - losses of economic agents due to price increases. Only the state can win in this case. His income from the issue of money is called seigniorage.
The consequences of inflation: loss of household savings, reduced investment, capital flight, etc. Fighting inflation is possible only at the macroeconomic level, this is the function of the state. Anti-inflationary policy includes methods of monetary and fiscal restriction.
Despite the attempts of the Government of the Republic of Kazakhstan to keep inflation within the 4-6% corridor, in 2006 it amounted to 8.6%. According to the Government's data, the inflation rate in 2006 was the highest in the last 5 years. Causes of inflation in the Republic of Kazakhstan:
1.monetary - an inflow of foreign exchange earnings, foreign capital, an increase in budget expenditures
2. non-monetary - despite significant savings of the population, the country has not yet managed to create the necessary instruments for their investment in real sector economy.
4. The relationship between unemployment and inflation. Phillips curve.
To assess the state of the economy in world practice, the "poverty index" is used, which is calculated as the unemployment rate + inflation rate.
The relationship between inflation and unemployment is expressed by the Phillips curve. Their dependence is manifested in the cyclical nature of the country's economic development. During the recession phase, when pensions begin to fall, the unemployment rate rises. And in the ascent phase, it begins to increase
inflation, while inflation is declining. The marginal levels of inflation and unemployment are reached, respectively, at the highest and lowest points of the economic cycle. Thus, at the peak of economic activity, the inflation rate is the highest and the unemployment rate is the lowest. On the other hand, at the bottom of the cycle, the unemployment rate will be the highest, and the inflation rate will be the lowest.
O. Phillips studied the relationship between changes in inflation rates, or rather, the rate of growth of wages and unemployment (Fig. 16.1).
The Phillins plotted the U unemployment along the horizontal axis. The vertical axis is those of wage growth (w). So, during the recovery phase, there was a high rate of wage growth and low level unemployment (wi; Ui). In the recession phase, on the contrary, there is a low rate of growth of wages and a high level of unemployment (w2; U-,).
The middle position (w0; U0) reflects the situation of Sustainable economic development, when the ratio of the growth rates of wages and unemployment is optimal.
That is, the minimum levels of both indicators have been reached simultaneously.
Later, the Phillips curve was modified: P. Samuelson and R. Solow replaced the rate of growth of wages with the rate of growth of the price level, or inflation (Fig. 16.2).
a
On the horizontal axis, they plotted the unemployment rate (U), and on the vertical axis, the growth rate of prices for goods and services (P). This graph more accurately reflected the fluctuations in inflation and unemployment rates at different phases of the cycle. During the upward phase (Pt; Ui), the inflation rate grows, and the unemployment rate decreases. On a recession (P2; U2), unemployment turns out to be high, and inflation - low.
Note that these curves are characteristic only for the short-term period.
Subsequently, statistics did not always confirm Phillips' conclusions. In the last third of the 20th century, it was noted
simultaneous rise in prices and unemployment. This phenomenon in economics is known as stagflation.
Stagflation is a simultaneous increase in inflation and unemployment rates, accompanied by an economic downturn.
The term "stagflation" comes from a combination of two words: stagnation, or stagnation, and inflation. Graphically, this is reflected by the shift of the short-term Phillips curve (SPhC) to the right relative to the origin (Figure 16.3).
In this situation, each point of the new dashed short-term Phillips curve (SPhCa) reflects higher inflation and unemployment rates compared to the solid curve (SPhC |). The simultaneous growth of these indicators intensifies the economic recession due to the reduction in aggregate demand due to the growth of the chain and the decrease in
The short-term Phillips curve characterizes the static state of the economy without reflecting long-term trends. It was modified by M. Friedman based on the theory natural level unemployment.
The theory of the natural rate of unemployment argues that in the long run, a moderate rate of inflation is achievable only when the natural rate of unemployment is high, which, in turn, depends on the state of the labor market. According to this theory, the Phillips curve is vertical in the long run. When natural and actual unemployment rates coincide, the labor market comes into equilibrium, and the actual level of price increases, or inflation, is equal to the forecast level (Figure 16.4).
To simplify the situation, we represent the short-term Phillips curve (SlJhC) as a dashed line with a negative slope. In the long term, the Phillips curve takes a vertical position (long term
LPhC long-term Phillips curve). On the graph, it is represented as a solid vertical line, indicating the level of full employment (U *).
The analysis of the long-term Phillips curve is based on taking into account the inflationary expectations of economic entities. It is conducted within the framework of two theories - adaptive and rational expectations. These theories examine the effect of inflationary expectations on aggregate supply when full employment is reached, or the natural rate of unemployment (that is, in the absence of cyclical unemployment). Despite the fact that modern curves reflecting the relationship between inflation and unemployment have undergone a certain change, they are still called Phillips curves.
Adaptive expectations theory
Adaptive expectations theory, even as the name suggests, suggests that inflationary expectations adjust from time to time. This is due to the fact that economic entities cannot predict the inflation rate with sufficient accuracy. As soon as a certain rate of growth in the level of prices and wages is established in the economy, business entities take them as a basis and assume that they will persist in the future.
Stimulating macroeconomic policy
government initially causes an increase in aggregate production and supply. People do not have time to immediately recognize the emergence of inflationary trends. In the short term, this leads to an increase in inflation and a decrease in unemployment. The volume of GDP is increasing. Graphically, this situation is reflected by a movement to the left up the short-term Phillips curve. When people realize that there is no real increase in their income, they
adapt to more high level inflation and demand higher wages.
By raising wage rates, entrepreneurs lose potential profits, which leads to a reduction in GDP and an increase in unemployment, which gradually reaches its natural level. Inflation, on the other hand, caused by the increased demand, persists, while its actual and expected levels are increasing. Short-term curve - moves up. - t position U *; Pi to position U *; Rg. With the next increase in aggregate demand, the process repeats itself. and the short-term curve moves even higher: from the U * position; Pr to position U *; P_t (fig. 16.5).
The still solid vertical line represents the long-term interpretation of the Phillips curve (LPKC), which reflects the level of full employment, and the dashed sloping lines represent its short-term variants (SPhC).
Thus, in the long run, there is practically no relationship between MS ** DU inflation and unemployment, and the Phillips curve is a vertical line.
Rational expectations theory
The theory of rational expectations implies that the inflationary expectations of economic agents correspond to the actual level of inflation. An important circumstance is that inflationary expectations of the population are based not on past experience, but on the results of the government's macroeconomic policy. The consequence of such expectations is that. that households begin to anticipate rising prices in the economy and immediately demand higher wages. Despite the rise in prices, the costs of producers and the price of products are increasing. Aggregate supply decreases due to a decrease in aggregate demand. The long-term Phillips curve is again a vertical line (Figure 16.6).
The solid vertical line represents
long-term interpretation of the Phillips curve (LPhQ, reflecting the level of full employment.
In this situation, it makes no sense to stimulate aggregate demand from the government. To an increase in demand, entrepreneurs will respond with an increase in prices due to the immediate demands of workers for higher wages.
The actual unemployment rate will not decrease, as entrepreneurs will not have funds left to expand their staff. Changes in the economy can be characterized by moving up the vertical Phillips curve: from the U * position; Pj to position U *; P2 and so on with each increase in aggregate demand.
It is important to take revenge that in the event of an error in the inflation forecast, the inflation rate can be assumed to be higher or lower than the actual level. Then, in the first case, the actual unemployment rate will decrease, while in the second, it will increase.
So, at present, most economists agree that in the short run there is an inverse relationship between unemployment and inflation. As for the long-term period, there is no such dependence. Therefore, the government's efforts to stimulate aggregate demand to increase the volume of GDP in conditions of full employment only lead to an increase in inflation rates.
Topic 4. National income: production, distribution and
consumption
- Production function. Distribution of national income by factors of production.
Distribution of income in classical theory: self-regulating economy.
Keynesian Income Theory: Inflexible Wages.
The country's economy consists of many firms that use production factors for production: labor and capital. The Cobb-Douglas production function is:
Q = Q (K, L), where K is capital, L is labor.
The distribution of national income between labor and capital means how much of the national income will go to pay wages and how much to profit and interest. Distribution is the second stage of the movement of the social product (production, distribution, exchange and consumption), which directly depends on production, i.e. from the aggregate supply.
Aggregate supply is a function of labor demand and labor supply, as well as the level of capital accumulation (net capital stock in the economy or the volume of previous investments). The shape of the aggregate supply curve is interpreted differently in different schools depending on the assumptions about the labor market; labor is the main factor determining the aggregate supply.
2. Distribution of income in the classical theory: self-regulating economy.
The classical economic theory in a broad sense includes the followers of A. Smith and D. Ricardo, as well as marginalists (K. Menger, E. Boehm-Bawerk and others), neoclassicists (A. Marshall, J. Clark, F. Edgeworth, and Fischer, A. Pigou, L. Walras, V. Pareto) and monetarists (M. Friedman). Common in the views of representatives of all these schools is the microeconomic approach to describing the economy and the assumption that no government intervention is required in a market economy.
The starting point in the classical theory is Say's law - the supply of goods itself creates a demand for them, since each manufacturer, having sold his product on the market, will spend all the funds received on the purchase of other goods, so the aggregate demand is equal to the aggregate supply. The fact that not all the money earned is spent on consumption, and part of it is saved in the classical theory is not taken into account, since the classics believed that money in itself does not represent value, but is only an instrument of exchange. Thus, macroeconomics appears as two independent sectors - money and real - this principle is called the classical dichotomy.
The real sector is a set of labor markets, investment resources, consumer goods and services. In all three markets, a stable equilibrium is always achieved due to the flexibility of prices, interest rates and wages, therefore, investments are equal to savings.
The money sector is a market for money in which the demand for money is equal to the supply of money. The amount of money in the economy does not affect real production, but only affects changes in nominal variables. The nominal variables include: prices, nominal wages, nominal interest rate. Real variables include: output, employment rate, real wages, real interest rate.
Thus, nominal variables are considered “flexible”, i.e. quicker reacting to changes in market conditions, and real ones - as "tough", i.e. slowly changing under the influence of market fluctuations, which is typical for long term.
The classical model assumes that:
- competitive markets
- full employment of resources, so the actual output is equal to the potential
- the volume of output depends on the number of factors and technology and does not depend on the price level
- changes in factors and technology are slow
- the equilibrium is maintained by means of "flexible" prices and nominal wages.
With the rise in prices, real wages decrease, as a result of which the demand for labor will exceed its supply. This will cause an increase in nominal wages, and a corresponding increase in real wages to the original level, as a result of which equilibrium will be re-established. Thus, the "flexibility" of wages will allow to quickly and relatively painlessly restore macroeconomic equilibrium. At the same time, the volume of output practically does not change, but only changes in the price level take place. The classics saw the reason for the crises in the excess or lack of aggregate supply, which is quickly and easily balanced due to the flexibility of prices, interest rates and wages.
- 3. Keynesian theory of income: inflexible wages.
1. The monetary sector cannot be neutral in relation to the real sector of the economy. Money is used not only as a medium of circulation, but also as a store of value, i.e. unused balances may not be spent in the present, but stored and then spent in the future ( this phenomenon is called preference (belt, trap) of liquidity), which reduces the aggregate (effective) demand.
2. Reducing effective demand ultimately leads to unemployment, because Firms, faced with a drop in demand, reduce supply and, accordingly, the amount of resources used. Thus, equilibrium is achieved not by a change in the price level, but by a reduction in supply and under-employment of resources.
3. The cause of economic crises is not a change in aggregate supply, but a lack of aggregate demand.
3. Investments are not always equal to savings, because they are carried out by different economic agents and for different reasons.
4. The economy cannot function effectively without government intervention. Keynes's proposed measures were aimed at combating unemployment and stimulating effective demand.
In the short term, the volume of aggregate supply depends on the magnitude of aggregate demand: in conditions of underemployment and price rigidity, changes in aggregate demand are primarily caused by
changes in output and only then changes in prices. That. to influence the level of output, the government should stimulate aggregate demand through fiscal or monetary policy measures.
Topic 5. Aggregate demand and aggregate supply. modelAD-AS
- Aggregate demand in a closed economy. Non-price factors of aggregate demand.
- 2. Aggregate supply: classical and Keynesian models.
- Short-term and long-term equilibrium in the AD-AS model.
Stabilization policy.
- 1.
Aggregate demand in a closed economy. Non-price factors of aggregate demand.
AD (Q D) = C + I + G.
In the structure of AD, the components are relatively stable, C, the most unstable - I.
AD curve shows inverse relationship between AD and the price level (P). This dependence can be derived from the equation of the quantitative theory of money: MV = PY, => P = or Y =, where
P - price level
Y - real volume of issue
M - the amount of money in circulation
V is the velocity of money circulation.
The higher the price level, the less real stocks Money, therefore, there is less quantity of goods and services for which there is a demand.
The inverse relationship between aggregate demand and the price level is explained by the effect of the interest rate, the effect of wealth and the effect of import purchases - CDS (considered last year). Non-price factors of aggregate demand include: welfare and consumer expectations, taxes, interest rates, subsidies and concessional loans, exchange rate fluctuations, external economic conditions and other factors affecting the AD components. In this case, the complex effect of several factors can have a mutually contradictory influence.
- 2.
Aggregate Supply: Classical and Keynesian Models.
Non-price factors of aggregate supply: technology, resource prices, taxes, etc.
The shape of the aggregate supply curve is interpreted differently in the classical and Keynesian schools, depending on what time period is considered. Differences in short and long term time frames are explained by the behavior of nominal and real variables. In the classical theory, a long-term time period is considered. The economy operates under conditions of full employment of resources, and the AS curve is vertical at the level of potential output (potential output - output when resources are fully occupied).
Keynesian theory deals with a short-term time period. The economy operates under underemployed resources, and the AS curve is horizontal:
There is another interpretation of the shape of the AS curve - curved, in which the classical and Keynesian segments are combined (i.e., without emphasis on time intervals) - was considered in the ET course.
- 3.
Short-term and long-term equilibrium in the AD-AS model.
In the classical model, equilibrium is established using a price adjustment mechanism.
If there is an increase in aggregate demand (from AD 1 to AD 2) and the equilibrium shifts from A to B, where the volume of output is greater than the potential, the price level remains the same for some time. However, rising costs cause prices to rise, which reduces aggregate demand. the new equilibrium is established at point C, which corresponds to the previous output, but at higher prices.
In the Keynesian model, an increase in aggregate demand stimulates output to a potential level and above, which ultimately leads to the same consequences as in the example considered.
- 4.
Stabilization policy.
Demand shocks - arise due to changes in the supply of money, the speed of their circulation, fluctuations in investment demand, etc.
Supply-side shocks - arise from sharp surges in resource prices, natural disasters, changes in legislation, etc.
Stabilization policy is a policy aimed at mitigating the effects of shocks and restoring macroequilibrium.
Example. A negative supply shock causes a rise in the price level (shift from SRAS 1 to SRAS 2) and a reduction in production (from A to B). The economy will gradually begin to adapt to the new conditions: prices will begin to decline and eventually employment and output will return to the previous level, i.e. to point A. However, this process can turn out to be protracted and painful, so the state is pursuing a stabilization policy by increasing either the supply of money or government spending. Then the curve AD 1 will shift to the position AD 2, and the economy will balance at point C, i.e. at higher prices.
Topic 6. Macroeconomic equilibrium in the commodity and money markets. modelIS-LM.
- Planned and actual costs. Keynesian cross.
Multiplier of autonomous costs.
Equilibrium in the market for goods. IS curve
Money and their functions. Monetary aggregates.
Quantitative theory of money. Exchange equation. Fisher's equation.
Keynes's theory of liquidity preference. The money demand Baumol-Tobin model.
Money supply. Money multiplier.
Equilibrium in the money market. LM curve.
Equilibrium in the commodity and money markets. Model IS-LM.
Relationship between AD-AS and IS-LM models.
Fiscal and monetary policy in the IS-LM model
- 1.
Planned and actual costs. Keynesian cross.
The purpose of this topic is to build the IS curve, which is built on the basis of the Keynesian cross, which expresses the Keynesian theory of national income.
Projected spending is the amount that households, firms, and the government plan to spend on goods and services. If firms are forced to make unplanned investments in inventories, then the actual costs will differ from the planned ones.
The planned costs in a closed economy are: E = C + I + G.
Substituting the consumption function, we get: E = C (Y-T) + I + G.
Assuming that the planned investments, government spending and taxes are fixed, we get that the planned investments are a function of income.
The curve of planned expenditures has a positive slope (since a higher level of income leads to more consumption and higher planned expenses), and the slope is equal to the marginal propensity to consume (shows how much the planned expenses increase with an increase in income per unit). In fact, it is a consumption function curve shifted upward by the amount I + G.
The economy is in equilibrium if the actual expenditures are equal to the planned ones: Y = E (Y is GDP or actual expenditures). On the graph, the line on which this condition is met is a line with a slope of 45 °. Combining it with the projected spending curve, we get the Keynesian cross:
Equilibrium is reached at point A, where the planned are equal to the actual.
In the process of achieving equilibrium, stocks play an important role: if the supply exceeds the demand for them, firms do not sell goods, increasing inventories, in the opposite case, they reduce stocks. Unplanned inventory changes induce firms to change output.
For example, GDP is above equilibrium (Y 1). In this case, the planned costs are equal to E 1, i.e. less Y 1, hence firms sell less than they produced, and stocks increase. Unplanned accumulation of stocks forces entrepreneurs to reduce output and workers, i.e. reduce GDP until income drops to an equilibrium level (from Y 1 to Y "). Conversely, an unplanned reduction in stocks raises output, employment and GDP to an equilibrium level (from Y 2 to Y").
- 2.
Multiplier of autonomous costs.
m =? Y /? A, where A - autonomous expenses, independent of income.
The multiplier shows how many times the initial growth (reduction) of total income exceeds the initial growth (reduction) of autonomous expenses.
For example, autonomous consumption (? С a) increases, which increases total expenditures (AD) and income (Y) by the same amount. The consequence will be a secondary increase in consumption already by the amount of МРС? С and an increase in expenses and income by the same amount, etc .:
? С а => AD => Y => C, etc.
Thus, on the one hand, the multiplier acts as a factor of economic instability, amplifying fluctuations in business activity, on the other hand, the action of the multiplier is used in fiscal policy.
If the actual equilibrium output is less than the potential one, then the aggregate demand is ineffective, that is, insufficient to ensure full employment, even though AD = AS. In this case, a recession gap (unemployment gap) arises - the amount by which the aggregate demand must increase in order for the equilibrium GDP to grow to the level of full employment:
? Y = Recession gap Multiplier of autonomous costs
If the actual equilibrium output is greater than the potential, then the aggregate demand is excessive. It is causing prices to rise and an inflationary gap. In this case, aggregate demand must be contained in order to ensure a reduction in aggregate income by? Y:
? Y = Inflationary Gap Multiplier of Autonomous Expenditures
- 3.
Equilibrium in the market for goods. IS curve
Combining the Keynesian cross graphs and the investment function, we get the IS curve, which reflects the relationship between the interest rate and the level of income: the higher the interest rate, the lower the level of planned investment and, therefore, the lower the level of income. The IS curve (investment-saving) shows the equilibrium in the commodity market, namely, how much it is necessary to change the interest rate when national income changes, in order for investment to equal savings.
- 4.
Money and their functions. Monetary aggregates.
The most important characteristic of money is liquidity - the ability to quickly and with minimal costs be exchanged for any other assets.
The money supply (money supply) is controlled by the Central Bank. To measure it, monetary aggregates are used, for example, in the US banking system:
M1 = cash in circulation outside the banking system (C);
check deposits - deposits in commercial banks, savings banks and other savings institutions;
demand deposits.
M2 = M1 + non-check savings deposits + small time deposits (up to 0000);
M3 = M2 + large time deposits (over 0000) + certificates of deposit, etc.
etc.................
The interaction of economic agents in macroeconomics is analyzed using models that represent an abstract reflection of real phenomena and processes in the economy studied with their help. The necessity of using the models is determined by the fact that they allow one to abstract from irrelevant details and reveal fundamental economic ties.
Models use two kinds of variables exogenous(initial information set outside the model) and endogenous resulting from the solution of the model. The purpose of the models is to find out how exogenous variables affect endogenous ones. Depending on the specific tasks of the study, different types models. Typification of models can be carried out based on various criteria:
1 according to the way of representing the studied process or phenomenon, the models are divided into graphic and economic and mathematical
2 by the duration of the analyzed processes - for short-term and long-term
3 according to the degree of coverage of foreign economic relations - on closed (not taking into account the impact of the foreign sector on the national economy) and open, built to take into account this impact
4 by the nature of the reflection of facts in time - into static, not taking into account the time required for the onset of certain events, and dynamic, characterizing the relationship of changes economic indicators in time
The entire system of markets distinguished in macroeconomics is reflected only in open long-term models. Closed short-term models only take into account the first four of these markets. Links established in the international foreign exchange market are considered only in open models economy. Real capital market like component market of factors of production, to one degree or another, is taken into account only in long-term models (economic growth or economic cycle). This kind of abstraction is explained by the specific focus of each type of model on research a certain circle economic problems.
The construction of macroeconomic models is based on taking into account four main types of functional relationships in the economy:
Behavioral, reflecting the typical preferences of economic agents. An example of this kind of dependence is the investment function (I = b * i), which characterizes the relationship between the interest rate as a factor that determines the investment decisions of entrepreneurs and the volume of investments
Technological, reflecting the links between economic indicators that are determined by the methods of organizing production established in society, the level of use of the achievements of scientific and technological progress, etc. Such dependencies include, in particular, production functions, reflecting the relationship between the cost of production and its results
Definitional, characterizing the content of the concepts under consideration, given by definition. This includes all dependencies between indicators of national accounts, as well as functions that clarify the quantitative certainty or structure of the phenomena under consideration. For example, the definition of the unemployment rate as the share of the unemployed in the labor force can be quantitatively refined by the function u = F / L (where u is the unemployment rate, and F and L are the unemployed and the active population, respectively)
Institutional, with the help of which the links between the indicators under consideration and the parameters formed by one or another are taken into account state institutions... These include the dependence of the amount of taxes collected (T) on the value of the state tax rate (tу): T = ty * Y, the dependence of the maximum amount of money that can be created commercial banks(M), from the required reserve ratio (r) determined by the central bank: M = 1 / r * N and a number of others
Ticket number 5 Basic macroeconomic indicators.
Macroeconomic indicators are the main indicators of the economy, with the help of which you can determine which phase is now - growth or decline. Serious changes in indicators lead to sharp jumps in both exchange rates and stock markets, so all economists and analysts are very closely following the release of macroeconomic data.
The main macroeconomic indicators are:
Gross national product
Gross domestic product
Net national product
Gross national income
Gross national disposable income
Final consumption
Gross capital formation
Net lending and net borrowing
Balance foreign trade
Gross domestic product
The main indicator of the system of macroeconomic indicators is the Gross Domestic Product, which characterizes the cost of final goods and services produced by residents of the country for a certain period of time, minus the cost of intermediate consumption. Gross Domestic Product is measured at market prices for final consumption, that is, prices paid by the buyer, including all trade and transport margins and taxes on products.
Gross national income
GNI is the amount of primary income received by residents of a given country over a given period in connection with their direct or indirect participation in the production of the GDP of their country and the GDP of other countries. Thus, GNI is greater than GDP by the amount of primary income received by residents of a given country from abroad (minus primary income paid to non-residents).
Primary income includes wages, profits, taxes on production, property income (interest, dividends, rent, etc.).
Gross national disposable income
GNRD differs from GNI in the balance of current redistribution payments (current transfers) transferred abroad or received from abroad. These transfers may include humanitarian aid, gifts from relatives received from abroad, fines and penalties paid by residents abroad. Thus, GNRD covers all income received by residents of a given country as a result of primary and secondary distribution of income. It can be determined by summing the gross disposable income of all sectors of the economy. GNRD is divided into costs by final consumption and national savings.
Final consumption
KP includes expenditures on final consumption of households, government, non-profit organizations serving households. At the same time, the costs of government and non-profit organizations serving households coincide with the cost of non-market services provided by these organizations.
Gross capital formation
Gross capital formation covers the accumulation of fixed capital, changes in material working capital, as well as the net acquisition of values ( jewelry, antiques, etc.), that is, these are investments by resident units of funds in objects of fixed capital to create new income in the future by using them in production. BH of fixed capital includes the following components: acquisition less disposal of new and existing fixed assets; the cost of improving unproduced tangible assets; expenses in connection with the transfer of title to non-produced assets.
Gross capital formation as an element of GDP includes gross fixed capital formation, an increase in working capital, and the cost of acquiring valuables. Accumulation can be calculated on a net basis, that is, less consumption of fixed capital (depreciation).
Foreign trade balance
The foreign trade balance is important element the final use of GDP and is defined as the difference between exports and imports. If the foreign trade balance is positive, then there is a net export.
2. Macroeconomic models, endogenous and exogenous variables
Mathematical and software modeling is one of the methods by which the subject of macroeconomics and any other economic science, for example, economic theory, etc., is cognized. Macroeconomic models are a simplified form of expression of economic reality. In other words, it is an abstraction, a formalized description of economic processes, categories and phenomena that always exist in a market environment in a certain relationship.
Any model, be it a diagram or a graph, visually represents the whole complex of statistical and other data in order to identify patterns of development, study the trends of any process.
Using macroeconomic models, the state determines the points of influence on the economy, the principles of the policy pursued, mechanisms for managing such phenomena and processes as the interest rate, wage dynamics, inflation rate, output, exchange rate, etc. All this is nothing more than internal, or endogenous, variables, the values of which are determined directly through the analysis of the model itself. Exogenous variables- these are elements external to the model, in the role of which the fiscal policy of the government and the monetary policy of the central bank and their instruments often act: changes in government spending, tax rate, refinancing rate, reserve rate and the size of the money supply.
The availability, compilation and study of models makes it possible to calculate all alternative options for the direction of macroeconomic policy, to optimize the combination of their tools to achieve sustainable economic growth, equilibrium market indicators and prevent inflation. From this point of view, the most convenient and promising are the models built to study inflationary expectations of all economic entities. They help prevent the emergence of so-called unexpected inflation, which can be the most dangerous for the market system. These models are specific, they have different shape for each individual country or region. The most general models that are needed to study any economy are macroeconomic models of aggregated supply and demand, equilibrium of the commodity and money markets, Keynesian cross, etc.
Despite all the unconditional advantages of building models, they nevertheless cannot be absolute and exhaustive. The difficulty lies mainly in the fact that it is very difficult to choose the most objective prerequisites for constructing a model from all possible ones. At the same time, the model may be the most complete, but difficult to understand and calculate. Should also be avoided too simple methods modeling, since they cannot contain all the material necessary for study and serve as a tool for analyzing economic reality.
It should be noted that economic variables are divided not only into endogenous and exogenous, they can be variables of stock and flow. The former show the state of an object at a certain point in time, it can be either the beginning or the end of the reporting period (for example, a year), or any time period. Flow variables are aimed at studying a process in dynamics, which makes it possible to make a comparison, choose from all alternative options the impact is the most optimal. In other words, this type of variables shows the flow economic process: the number of unemployed per year, GDP, the annual volume of investments, incomes, expenses, etc.
From the MBA book in 10 days. The most important program of the world's leading business schools the author Silbiger StevenWhat are the production costs? Constants and Variables? In terms of costs, the first question for a marketing manager should be: "Which of my costs are variable and which are constant?" Does it sound like accounting? So this is it. Variables include costs,
From the book Management accounting. Cheat sheets the author Zaritsky Alexander Evgenievich53. Types of costs: variable, constant, mixed To predict the potential volume of profits, an enterprise needs to compare the total amount costs, which are divided into variable, fixed and mixed.
by Forrester Jay7. 6. Auxiliary variables Auxiliary variables were isolated as independent concepts from the decision functions, since they have an independent meaning. They are located in the channels of information flows between the levels and functions of decisions that regulate
From the book Fundamentals of Enterprise Cybernetics by Forrester Jay7. 8. Variables in other diagrams Very often a system diagram is divided into parts, which are depicted on separate sheets. In fig. Figures 7–8 show how to handle the start and end points of flow lines on other sheets. From fig. 7–8, it can be seen that in this case
From the book Fundamentals of Enterprise Cybernetics by Forrester JayChapter 11 EXOGENIC VARIABLES Variables that are independent of the system represented in the model (exogenous variables) can be used powerfully as a kind of test signal. In this capacity, they make it possible to find out how the model reacts to a certain course of action.
From book Economic statistics author Shcherbak IA10. Main macroeconomic indicators Main macroeconomic indicators: 1. Gross Domestic Product (GDP) is an SNA indicator that characterizes the cost of final goods and services produced by residents of a country for a given period. Gdp is equal to the sum
From the book The Default, which could not have been by Gilman MartinMacroeconomic and structural issues Economic system collapse the former USSR was due to its low productivity, lack of flexibility in responding to dynamics of demand, general inability to ensure sustainable economic growth and obvious
From The Steep Dive [America and the New Economic Order After global crisis] the author Stiglitz Joseph EugeneMacroeconomic Battles In the cathedral of traditional economics, there are many chapels dedicated to specific issues. Each of them has its own priest and even uses its own catechism. The war of ideas that I described above manifests itself in the form of many
From the book Enterprise Economics: lecture notes the author Dushenkina Elena Alekseevna3. Fixed, variable and total production costs Different types of resources transfer their value differently to finished products... In accordance with this distinguish between fixed and variable production costs. Fixed production costs - costs,
From book Economic analysis... Cheat sheets the author Olshevskaya Natalia89. Models of deterministic factor analysis and additive models Deterministic modeling of factor systems - simple and effective remedy formalization of the relationship of economic indicators. It serves as the basis for quantify the role of individual
From the book Marketing Management author Dixon Peter R.Direct variable costs Direct variable costs, such as direct material costs and labor costs, are directly related to the volume of production and sales, ie. increase with the growth of production and sales. With a drop in production and sales, you should expect
the author author unknown7. MODEL OF ORGANIZATION: PRIMARY VARIABLES A social system can be described by highlighting a number of variables that characterize it. These variables can be broken down into three classes - primary variables, control variables, and efficiency variables.
From the book Organization Theory: The Cheat Sheet the author author unknown8. MODEL OF ORGANIZATION: VARIABLES OF CONTROL AND EFFICIENCY Variables of control are the following characteristics control system. 1. Organizational structure management - the main of the controlled, rebuilt at the will of the head of the organization, its
From the book Black PR. Defense and attack in business and beyond author Vuyma AntonVariable properties of the concept. In what follows, we will call them variable derivatives of a concept or variable components of a concept. The variable derivative of a virtual concept is a changing material or virtual object by interaction, which
From the book Fundamentals of Management author Mescon MichaelInternal Variables Internal variables are situational factors that exist within the organization. And since organizations are systems made by people, these variables are primarily the result of decisions made in the management process. But it is not
From the book Practice and Problems of Business Process Modeling the author of any E ANDSaving the route of the model as a separate model linked to the common business architecture model base In order to apply some standard means ARIS (for example, cost analysis, time analysis, simulation, etc.) to models, they need to be prepared in advance as